Why commercial Process Mining does not do it (that much)
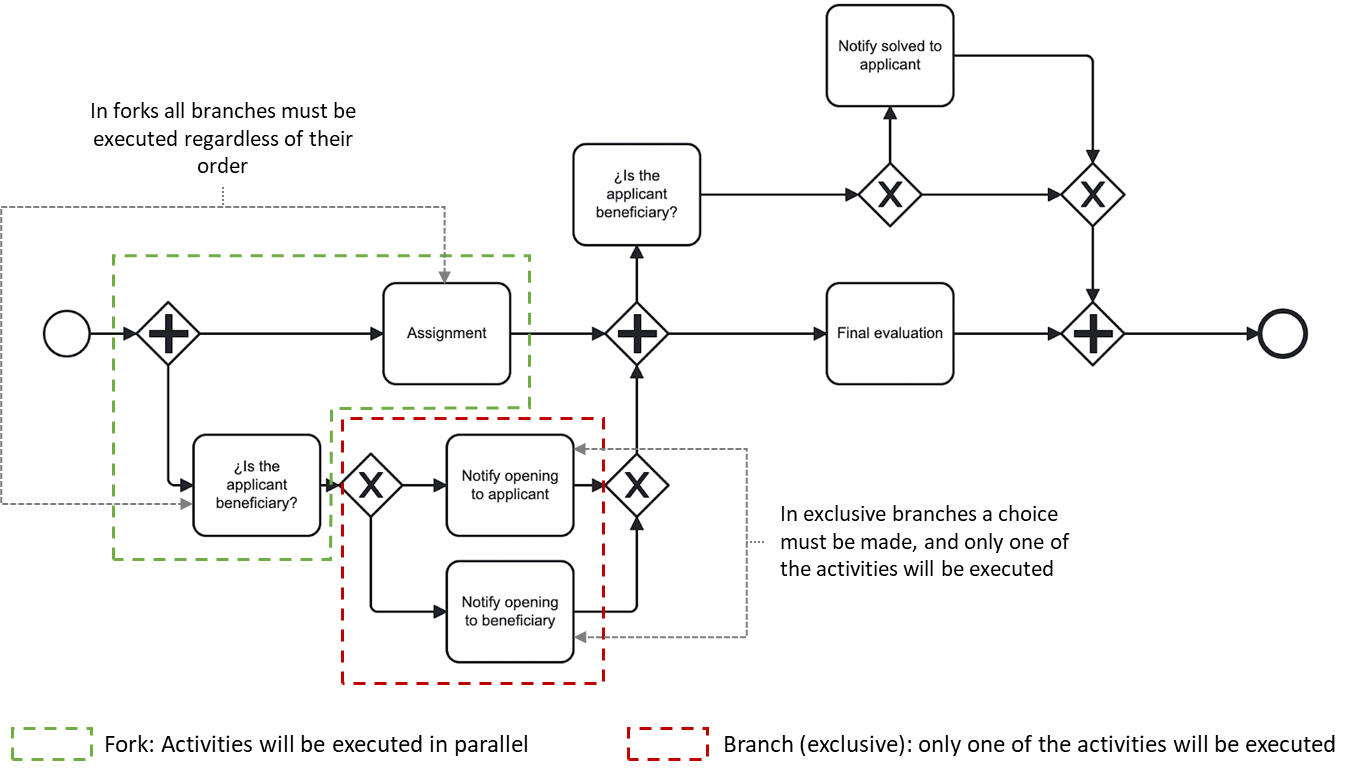
One of the main advantages of discovery algorithms in process mining is that they are able to produce process models that abstractly represent how execution flows. This includes determining and modeling when activities are performed in an exclusive way (a choice in the process) or, on the contrary, can be done in parallel (a fork in the process).

Process model in BPMN 2.0 notation with forks (+) and choices (x)
However, although such representations of the process flow are useful (and this is rather clear when approaching this matter from a process design perspective to understand direct dependencies between activities), there is something about the concept of parallelism that does not seem to fit commercial process mining software.
If we take a look at how the most well-known process mining platforms in the market actually work, we’ll see that process representations usually adopt the form of directed graphs, leaving notations of parallel executions out of the equation.
We believe there are a number of reasons why this occurs, which range from the complexity in the original semantics associated with the academic concept of parallelism to how integrating such semantics into the discovery models complicates things from a technical and explanatory point of view.
Back in the university days, we used to work with an adaptation of the Inductive Miner algorithm to discover process models, but at times struggled to make sense of those visualizations and, most importantly, struggled to make other people understand what was actually occurring when we referred to “parallel activities”. This leads directly to the basic problem of semantics. What the hell does “parallel” even mean?
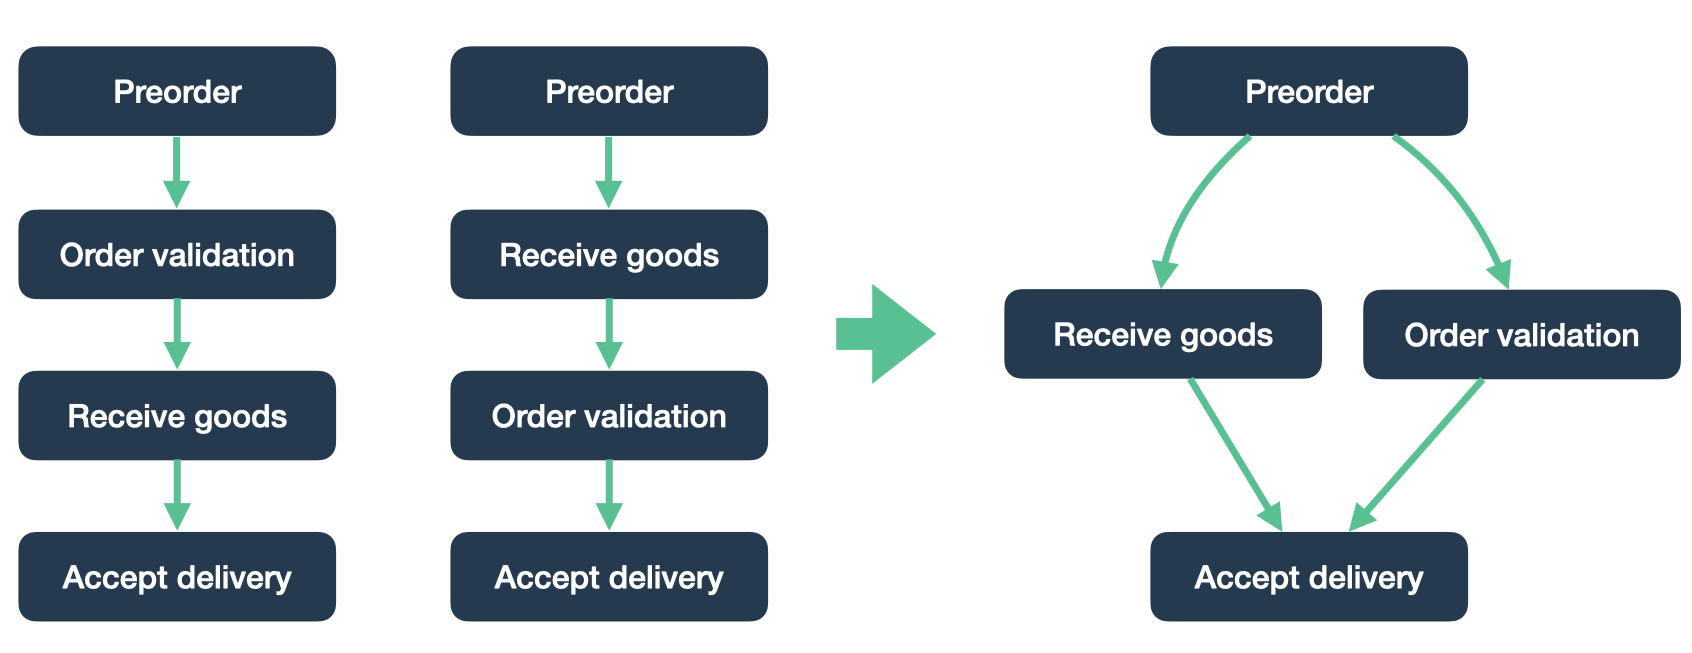
The semantic problem stems from the fact that the academic interpretation of parallelism generally differs from how a layman understands the same concept. In process mining, two activities are considered parallel to each other if they can be executed in any order. For example, for a process with four activities A, B, C and D, if the sequences ABCD and ACBD occur, we can assume that B and C can be executed in parallel, since they can appear in any order with respect to each other. This idea is part of the assumptions that discovery algorithms such as Alpha Miner or Inductive Miner make.

Discovery algorithms assume parallelism exists when contiguous activities (or subprocesses) appear in different order.
However, most of the clients we have talked to regarding parallelism understand it as two activities taking place at the same moment in time. In other words, users are thinking about concurrency. But then, how does temporal concurrency actually relate to parallelism a la process mining?
If we assume that parallelism exists between two activities, concurrency is always a possibility. Certainly, if two activities can occur in any order with respect to each other, then it makes sense they can occur simultaneously too. Nevertheless, if we only resort to discovery algorithms, we cannot be certain that concurrency is taking place. Why? Because these just use the order of event sequences to infer if activities will be connected through choices or forks, and time here plays no part. In fact, process discovery does not need timestamps, as long as there is a field that indicates the order of the events in the process log.
As a result, displaying process models that include graphical representations of parallel activities can lead to misinterpretations in many cases, because users may wrongly understand that concurrency is happening without any actual evidence. On top of that, some metrics such as the frequency of activities are harder to calculate and more difficult to understand when considering parallelism.
We believe this led to many commercial tools resorting to directed graphs, which are straightforwardly based on the activity sequences of the process traces. This simplifies data processing, analysis, and visualization as well, but does not solve the problem of how to approach a proper concurrency analysis. Visualizations with parallelism are still present in some platforms, but do not appear as core features in any of them.
On top of this, many commercial platforms allow only one timestamp in the logs the user uploads. This means activity durations cannot be calculated and, without them, the possibility of analyzing concurrency also gets discarded, since we need events with “start” and “end” timestamps to compute activity durations to determine if they overlap in time.
With all the previous considerations in mind, at Inverbis we have adopted an approach focused on concurrency. Although Inverbis can mine logs with just one timestamp when needed, we believe double timestamps are useful, since activities with durations make for a richer analysis, providing a better distinction between productivity and waiting times. However, at the same time we are also aware that this strategy introduces new problems, as activities with durations may chronologically overlap in many different ways, and this must be made known to the users somehow.
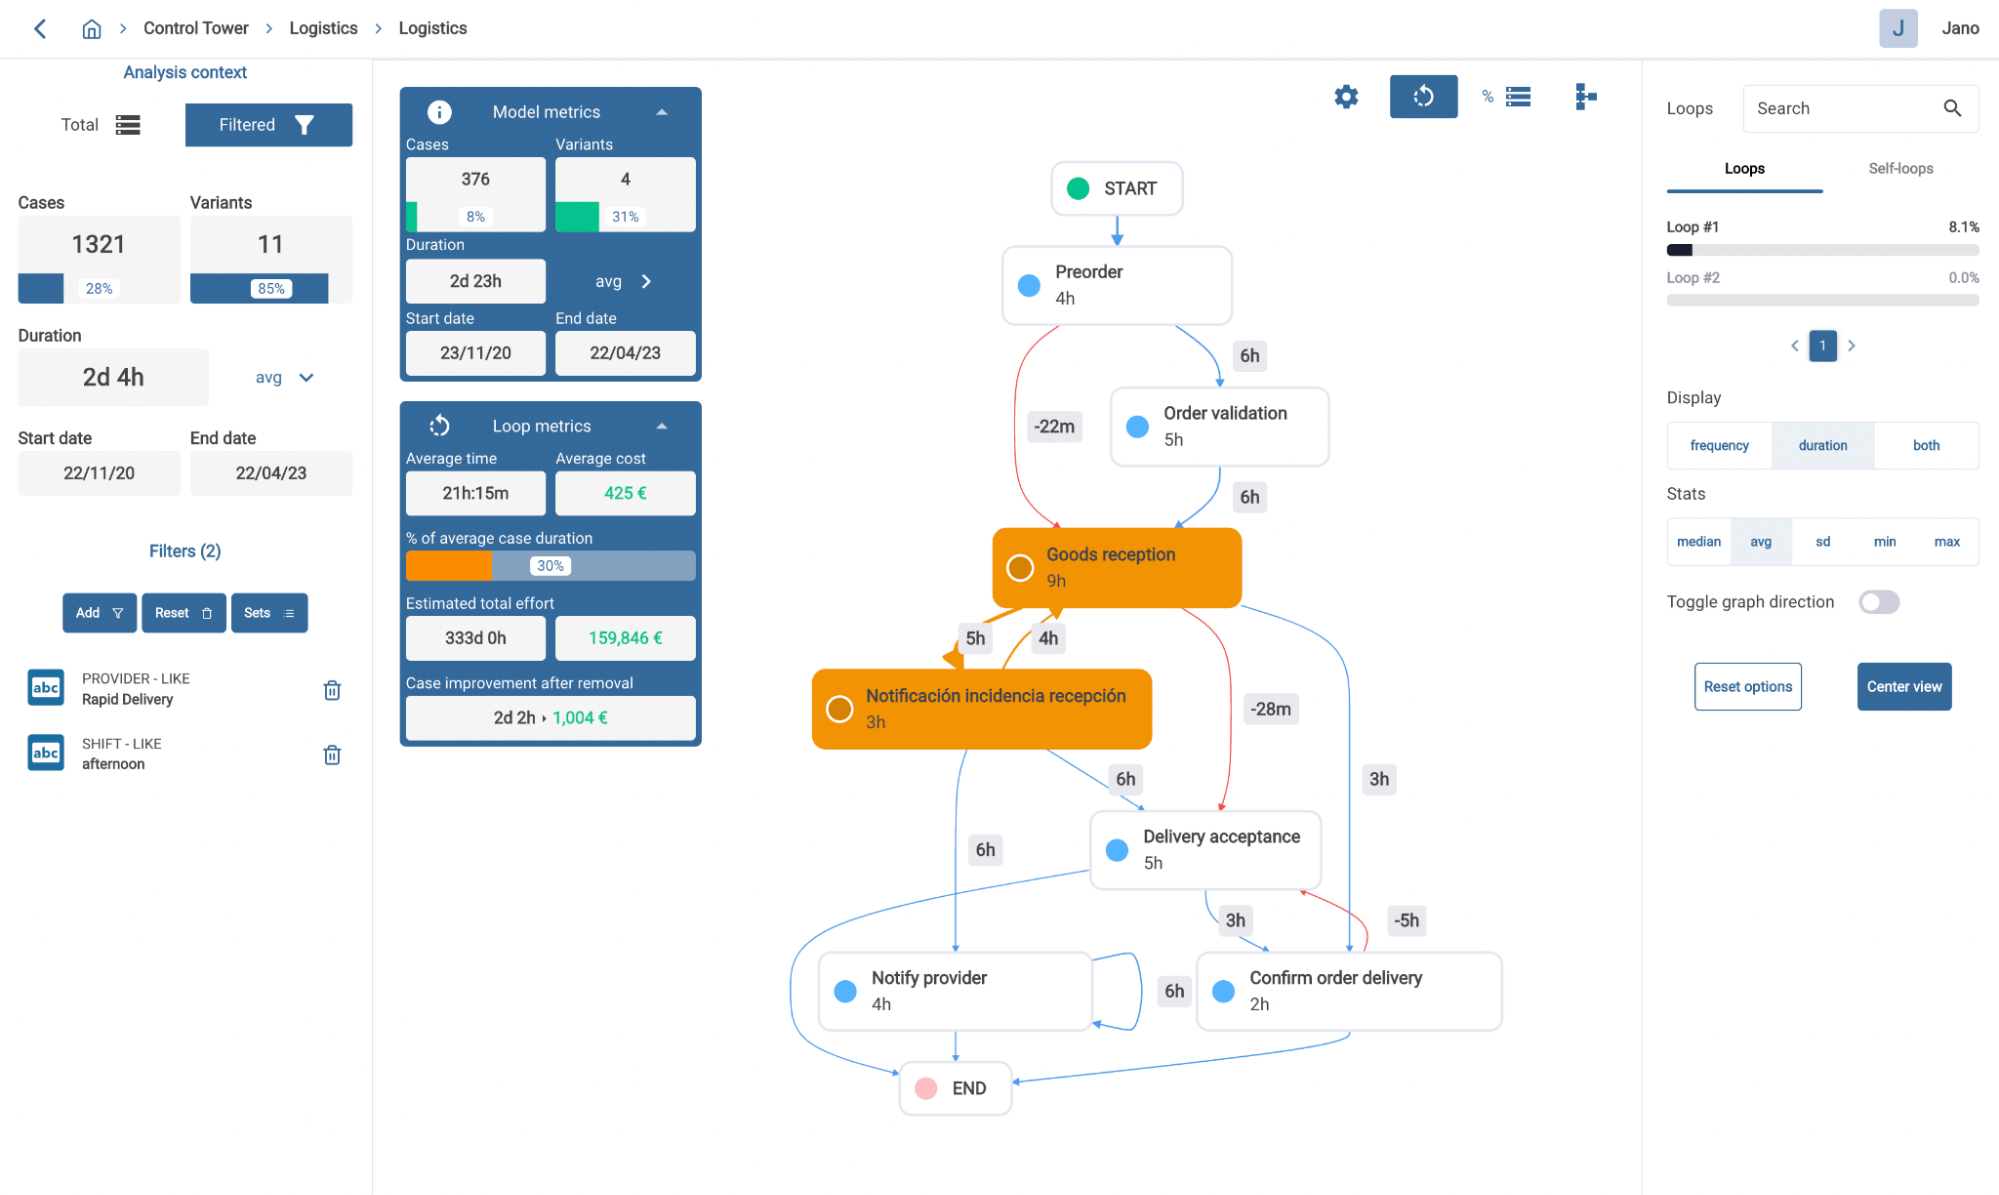
Each approach for process discovery integrates different assumptions about the order of process activities and how these depend on each other. Ours assumes that activities should be sorted according to their start timestamp. When overlaps in time happen between different activities, durations in the connecting arcs tend to be shorter and negative in many cases, and aggregate metrics such as median or average may end up being negative as well.
In these cases, we highlight transitions in a different color to make overlaps explicit and accordingly display negative duration values. This allows the user to identify situations where activity overlaps in time clearly condition transition times. Furthermore, it helps shed some light on concurrency within the process model, which is uncommon in this kind of visualizations.

Loop inspector in Inverbis showing a process model with some activities that, on average, start before the preceding ones are finished.
Still, for some processes where concurrency is common and relevant for analysis, other kinds of analytic and visual approaches should be used to complement the standard process discovery tools, which are, as we have discussed, less suited to address this kind of scenario.
References (by order of appearance)
- Business Process Model And Notation.
- Leemans, S. J., Fahland, D., & Van Der Aalst, W. M. (2013). Discovering block-structured process models from event logs-a constructive approach. In Application and Theory of Petri Nets and Concurrency: 34th International Conference, PETRI NETS 2013, Milan, Italy, June 24-28, 2013. Proceedings 34 (pp. 311-329). Springer Berlin Heidelberg.
- Van der Aalst, W., Weijters, T., & Maruster, L. (2004). Workflow mining: Discovering process models from event logs. IEEE transactions on knowledge and data engineering, 16(9), 1128-1142.
Image by Barna Bartis in Unsplash

![[Webinar] Breaking down data silos to unleash the power of Process Mining](https://web.inverbisanalytics.com/wp-content/uploads/2023/06/breaking_silos_tx_inverbis_bothtimes-400x250.jpg)

